The Russian Orthodox Church’s sources are of great importance for historical and demographical studies. However, their full value use, processing and interpretation demand a lot of preliminary work. The article addresses the problem related to territorial localization of parishes and its probable solutions by means of geographical information technologies.
1. Is it possible to say anything about the parish territory?
The sources first mention the term “parish” in the 15th century. At that time the parish was not a territorial unit, but rather the priest’s flock who regularly made confessions and communions. The ties between the priest and his people were very important. Starting with the middle of the 16th c. the clergy began to describe parishes stating the number of households, parishioners and so on to calculate the tax in the eparch’s favor. During the Synodical period (18th – early 20th centuries) the parish was the lowest church unit when the middle layer was composed of the clergy administration (dukhovnye pravleniya) and the upper one being the consistory. At that time the term had several meanings: 1) the lowest church-administrative district (with and without a church); 2) the population of the district that is parishioners; 3) the church community – parishioners and the clergy headed by the archpriest; 4) only the clergy (the term was more rarely used) (Bernshtam 2005).
Thus, the parish is a church territorial district including settlements related to a particular church as well as the community of people who pray and satisfy other religious demands in a temple. Though parishes were territorially formed (person’s relation to a parish depended on his residence), their real boarders were not mapped. That is why it is interesting to reconstruct the parish system by means of GIS. It is very important since throughout the 18th – early 20th centuries the huge documentary base was being formed that included primary sources allowing one to study historical and demographical issues at a parish level assisted by computer technologies.
2. GIS to localize the parish’s territory
The basis for parishes net formation (more precisely, parish boarders) is the creation of such a surface model which accounts for the location of basic network points presented in the form of settlements net with churches. From the geoinformatics viewpoint, the search for the centers is not a difficult task. A more interesting and difficult task is to build surface models which provide for determining the set of optimum design parameters (boarders, distances, areas, etc.).
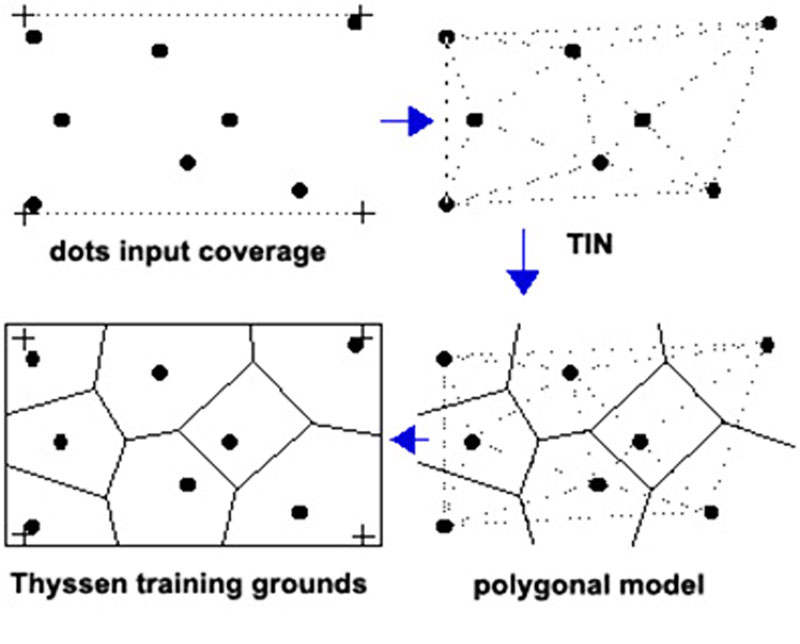
To do this one has not only to calculate the “centers”, but build interpolation and approximation models (Campbell / Shin 2011) in relation to parishes demonstrating, for instance, population migration, its social and occupational composition as well as forming the dispersal system. The method of geofields and Thyssen polygons formation algorithms can be of use here. Based on Thyssen triangulation (that is mostly relevant to the boarders identification task) two points are linked if their polygons have a common boarder. This algorithm lets one to get a system of non-overlapping triangles with the centers inside each of them. The drawback of such a division is the net of acute triangles. This drawback is negligible in Delaunay triangulation since each triangle edge forms middle perpendicular lines forming the edges of Thyssen polygons. As a result we don’t have the net of triangles, but the net of topologically correct polygons which edges cross points equally-spaced from the basis centers (figure 1).
Figure 1. Thyssen polygons based on points distributed data (source: https://desktop.arcgis.com/ru/arcmap/10.3/tools/coverage-toolbox/how-thiessen-works.htm).
The initial fact-based special base is data of clerical lists on the location of churches as parish attraction centers. A Thyssen model used at the initial stage is sure to be unable to form ideal parish boarders. However, it is this model that allows one to calculate and draw lines of conventional boarders taking into account geometrical centers and all directions. It is no doubt that new data may correct such boarders and the authors know about that. The formal reason for drawing such boarders is based on the character of these initial data and one can trace natural ties with the population settlement system.
An additional tool that demonstrates or explains the nature of ties could be a map or a model of population density (factually being a derivate of the population settlement system). However, the creation of density models is the next step in case the initial spatial database is formed at its maximum. A prospect is a weighted density model since the classical model is hardly able to provide for additional spatial analytical data.
3. GIS to analyze parish data sets
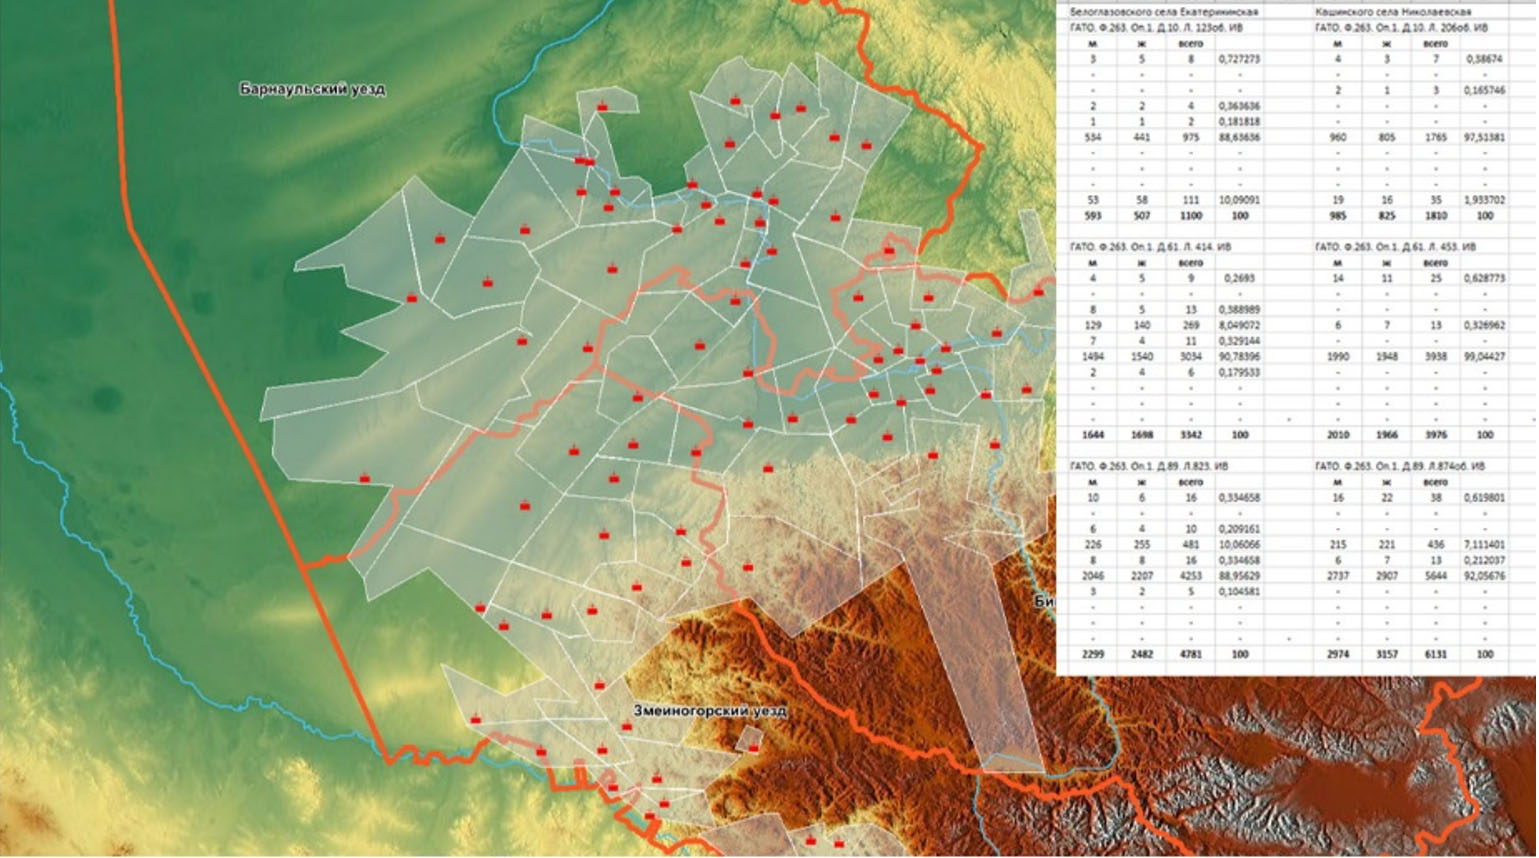
Emphasis is laid on the analysis of parish data distribution. Initial statistics is tied with GIS via geocoding understood as the attachment of statistical data to particular spatially defined objects which have distinct geographical location and coordinates (Schmandt 2017). The function of geocoding will be executed in case there are ties with the file database in the form of structured relational MSExcel tables (рис. 2).
Figure 2. The location of parishes in GIS and a fragment of MSExcel file database.
Archives store a lot of primary church sources (parish register books, confession statements, clerical lists). Their data can be presented within the church parishes’ space (Vladimirov et al. 2006). Herewith, the focus is on demographical and social processes studied on the basis of interrelated database technologies and GIS technologies (Vladimirov / Sarafanov 2013). It must be noted, that historical demography outside Russia has been applying GIS for long (for instance, Alves 2005). The analysis results can be of use when comparing similar events and processes in other regions in different chronological periods. The 19th century is of particular importance since there were many changes of parish boarders in Siberia caused by active church construction. The proposed technique of algorithmic parish boarders outlining and formation of topologically correct parish territories within new GIS-layers offers new opportunities to study historical, demographical and social data. Construction of time heterogeneous Thyssen models will provide for tracing the dynamics of parish boarders change and understand the final configuration and an affected area or an “attraction area”.